There are currently over 100 different definitions of circular economy and the Ellen MacArthur foundation provides one of them. In 2005, Ellen MacArthur set the fastest time for a solo sailor to circle the world. Five years later, she set up the foundation in her name to accelerate the transition to a circular economy. It says:
“The circular economy tackles climate change and other global challenges like biodiversity loss, waste, and pollution, by decoupling economic activity from the consumption of finite resources”.
On a global scale, there are different ways of measuring circularity performance. The circularity gap report states that only 7.2 % of all material inputs into the global economy are based on secondary material flows. This figure has been decreasing over the six years that the report has been published. Then there is the Earth Overshoot Day – August 2 in 2023. This is when the demand for ecological resources exceeds what Earth can regenerate during 2023. These figures are alarming, but also in a sense a little difficult to get a grip on. So how can we relate to this in our daily operations and businesses?

Circularity at Ovako.
Circularity at Ovako
Nicklas Magnusson, Process Development Manager, Climate & Environment at Ovako explains that Ovako’s products have a recycled content of 97 or 99 % - depending on how you count. Broadening the picture, we have many secondary material flows that are either being recycled or used as input into other product categories. For example, EAF slag used for road building materials, ladle slag for mineral wool production, recycling of metals and excess heat used for district heating.
Furthermore, we work with customers to help them make the best use of our engineering steel; using as little resources as possible to deliver the same functionality over the lifetime of the product.
Finally, when a product reaches its end-of-life, it is important to ensure it can be disassembled and recycled. Currently, the global average is about 85 % and the limiting factors for improving the future recycling rate are collection, disassembling, sorting and the copper content.
Taking all these factors into account when defining circularity indicators is difficult. There are ongoing standardization initiatives, but this takes time. To improve, and make circularity even more important than today, collaboration throughout the value chain is key. That truly makes the best use of our different knowledge and expertise.
The same applies to carbon footprint as well. It is crucial to get a better understanding of what we and our customers expect from each other. Because we all have targets regarding CO2 emissions and many also for circularity. But how are these targets transformed into expectations or requirements throughout the value chain? It is vital to address these questions to get the predictability essential for investment and on-target delivery.

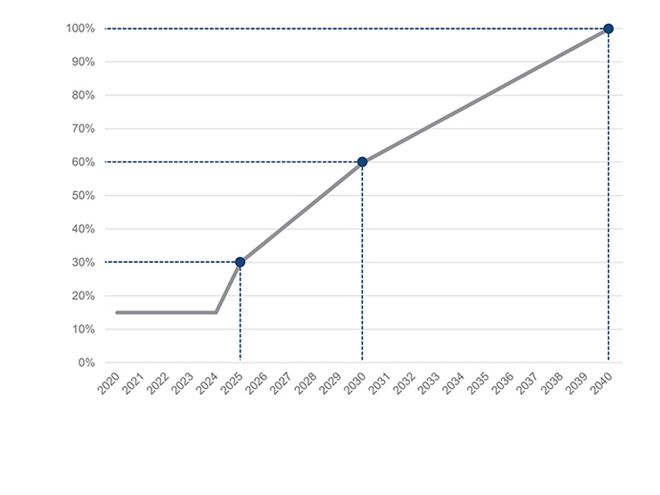
Swedish transport administration carbon reduction targets.
Examples from other industries
Before Ovako, I was in the building industry for 10 years. I would like to share some examples of how other players have tackled this.
First, there is the Swedish transport administration, the government agency responsible for the long-term infrastructure planning, construction and operation. Its reduction targets for the embodied carbon in infrastructure.
As one of the biggest public procurers in Sweden it translated its reduction targets into contractual requirements. Each project contains a CO2 reduction requirement referenced regarding the baseline and in line with its outlined reduction targets. So, if a project ends by 2030, the average reduction requirement for the embodied carbon is 60 % against the CO2e baseline, also defined in the contract.
If the contractor doesn’t deliver, there is a penalty of around Euro 200 Euros per ton of CO2e not reduced in accordance with the contract. However, if they outperform the requirement there is a bonus of around Euro 100 per exceeded ton of CO2 reduction.
Therefore, what this model really is about is predictability. Every contractor knows what’s expected. And they know they need to deliver to make profit.
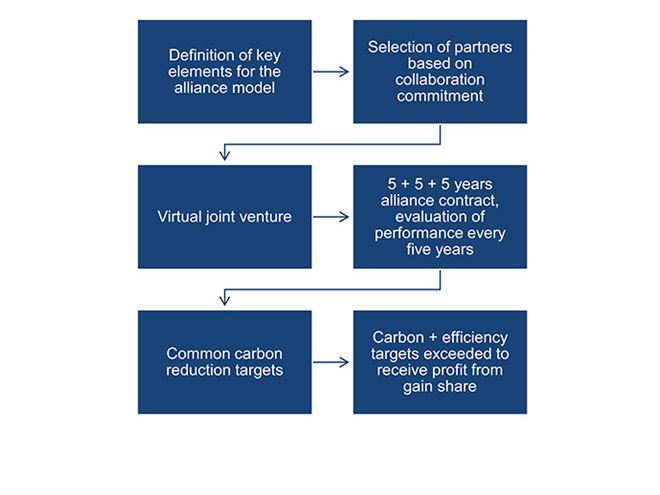
Another example is from Anglian Water, the largest water and wastewater company in England and Wales. To meet its CO2e reduction targets it is creating one “Alliance partnership”. This consists of seven companies working in partnership to deliver a program of work worth well over Euro one billion.
Anglian Water selects partners based on their collaboration commitment, among other aspects. They are given a contract for five years, which may be extended up to another 10 years according to their performance. Together they form a virtual joint venture with common resources and of course carbon reduction targets. To receive any profit, the team must exceed its efficiency targets and deliver low carbon solutions.
Every five years, Anglian Water and the Alliance leadership team evaluate each partner’s contribution. Based on this assessment, partners may be renewed, replaced or supplemented.

Anglian Water’s Alliance partnership model.

There are different ways of reporting CO2 emissions.
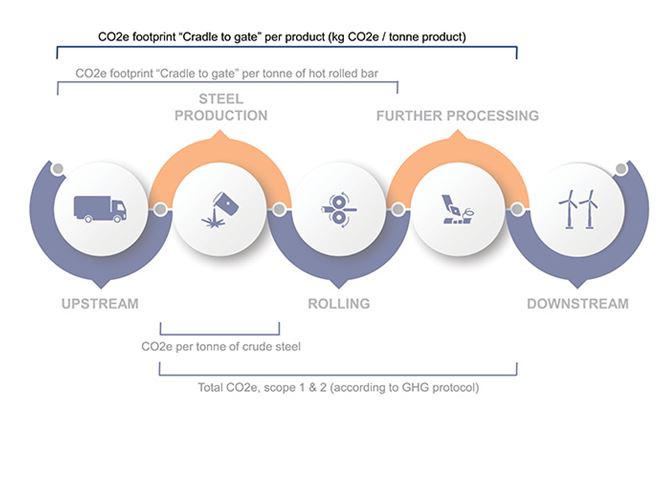
Taking a cradle to gate perspective
The building industry has a major advantage as there is a single standard for carbon footprint accounting. No matter if you produce steel, mineral wool or concrete, you have to follow the same core principles when declaring CO2 performance in an Environmental Product Declaration (EPD). The various EPDs for each one can slot together to form a coherent whole.
In contrast, the steel industry is rather more segregated. As Figure 5 shows, there are many ongoing initiatives. They all have the same basic aim of transforming the steel industry to net zero emissions, but with different measures and calculation rules. That is why Ovako is focused on promoting as much as possible a cradle-to-gate perspective for the products we deliver.
Ovako’s cradle to gate approach goes beyond the CO2e per tonne of crude steel or the scope 1 and 2 emissions. This can be either for a hot rolled bar or even better for the specific product we deliver. The result is customers can compare the CO2e indicator for the material we supply. They can also combine all the different CO2e indicators for the various materials and services they use to determine the overall carbon footprint of their final end product.
The three key elements for transparency on circularity and carbon footprint
To summarize: how do we make circularity and carbon as key properties of products – and how do we truly work with them to deliver even better performance than today? Tricky questions but the following elements are for sure of importance:
- Collaboration: Making the best use of resources to improve products, circular flows and reduction targets
- Predictability: Understanding what’s required by who and when in order to invest and deliver accordingly
- Measurability: Declaring the product specific CO2e footprint from cradle to gate to enable fair comparisons and also to allow customers to assess the CO2e footprint of their end products
Ovako’s first step was to first develop EPDs covering the cradle-to-gate for a hot rolled bar. These are verified by a third party and externally available. Then, we added CO2 figures for further processing and had those calculations reviewed externally. This is the basis for our carbon calculator. New for this year is that we have transformed our tool into a web-based solution. This enables us to provide carbon footprint data very quickly for all our products.


