The carbon footprint of a material is just one aspect of a product’s environmental impact. How it is transported also influences the carbon footprint – and the impact can be surprising. Ted Lundström, our Head of Global Logistics, explains why.
Many choices are available to today’s logistics managers for getting products from A to B. At first glance, one option might seem like the more sustainable option. However, it’s important to look closer as there’s more to the climate impact of transport than it may seem at first.
We’ve developed two case studies to illustrate this. They are based on typical transport alternatives that are often seen in the public debate. The first is moving a one tonne (1,000 kg) product load 10 km by bike or truck, while the second compares transporting a full load using a zero emission heavy duty vehicle (ZE HEV) or a conventional diesel truck. It is important to understand that these case studies are intended to illustrate the differences and they are simplified for this purpose.

Bike v. truck over short trips
To compare the merits of transport over a relatively short distance, we ran a comparison of the environmental impact of pedal power with a diesel truck. With a maximum load of 100 kg, the cycle courier would need to divide the total 1000 kg load into smaller packages. They would also need to use energy to power the bike, not only to carry the load but also the weight of the bike and their own body. This created 10 trips carrying a total gross weight of 255 kg each time in this example.
According to dietary specialists at Swedish lifestyle firm Arono, the cycle courier will burn 0.33 kilocalories per km for each kilogram that has to be moved.
To convert this into CO2e footprint, we’ve assumed the rider has a healthy appetite for burgers at the Max restaurant, which also has a verified CO2e footprint according to the Greenhouse gas protocol and ISO 14087 on their meals. An original burger contains 581.7 kcal and has a CO2 equivalent of 2.2 kg. Over 10 trips, that will add up to 31.8 kg.
We compared this with a single trip by a 40-tonne gross weight standard European truck carrying a partial load of one tonne. We assume that the truck will consume 0.36 litres of standard EU B7-grade diesel per kilometer, which has a WTW (well to wheel) CO2e WTW footprint of around 3.0 kg per liter. Calculating carbon footprint in this case is a simple matter of multiplying these together.
Long-distance comparison of electric versus diesel trucks
For the long-distance option, we compared an electric vehicle against a conventional diesel truck. We chose a typical route covering 690 km between a port on Poland’s Baltic coast and a city in the south of the country, with both trucks carrying a full load.
The electric consumed 1.7 kWh/km using energy from the Polish power grid, which has a carbon footprint equivalent of 0.931 kg/kWh. This creates a footprint of 1092 kg CO2e WTW.
In comparison, the conventional truck is assumed to use 0.31 liters of EU type B0 diesel per kilometer. This creates a footprint of 670 kg CO2e WTW, which is significantly less than the electric option.
This illustrates the importance of considering the energy mix and carbon footprint of electricity from the local power grid and why it is important to cover the WTW fuel life cycle. An electric is often a more sustainable solution but as this shows, it depends on how the electricity is produced.
This shows the truck option has a carbon footprint of 11.88 kg WTW, which is almost three times lower than the burger-powered cargo bike. The cyclist could choose a veggie burger to cut their CO2 footprint by 75 percent. However, by using the truck’s full capacity of 25 tonne net load, the logistics firm can slash their CO2e footprint by almost 96 percent.
Calculating carbon footprint in a complex world
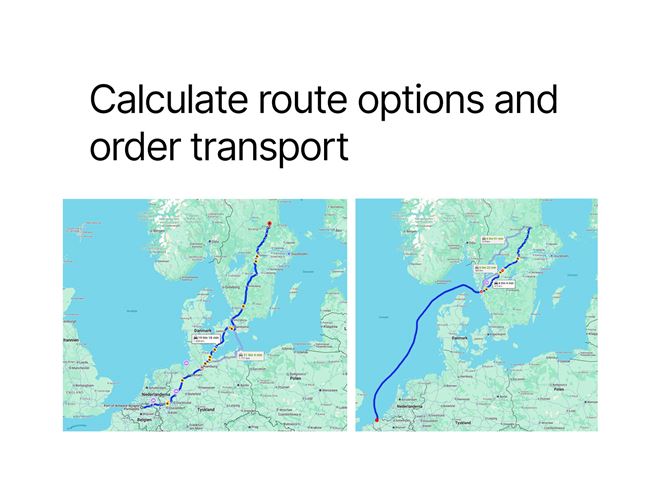
It’s also important to remember that transportation often contain of different modes of vehicles, fuels and other features that affects the CO2e footprint. Logistics managers should consider the environmental impact of transportation at every stage and by all transport modes. This should also include the trips that empty trucks and trains must make to be in the right position to pick up the load.
You can find more information around this under Chapter 4 of the ISO 14083:2023 standard. We have established our own model and data to try and fulfil the requirements of this standard, using data from transport operators.
The approach can be applied to transport between any two destinations by cutting the journey into sections according to the specifics of each transport chain element. This enables our team to compare different transport chains and identify opportunities to optimize our deliveries for carbon footprint. By doing this before we schedule the transport operation we can evaluate our CO2e in advance.
Looking to the future, transport will become even more complex as the diversity in fuels will increase, such as electric and hydrogen powered freight technologies and the source from which the fuel is produced. This will increase the potential to improve sustainability but will require mastery of data and evaluation. Therefore, we expect that the methodology we have put in place today will reap rewards in the future.
Figure 1. Car // Figure 2. Boat


